QGIS to describe the Cesena’s Wall
The ECAMPUS UNIVERSITY was created as an online University and recognized by the MIUR (Italian Ministry of Education, University and Research) by the Ministerial Decree of 30 January 2006. It was formed with the aim of providing access to university through its eLearning platform to young people, professionals, entrepreneurs, executives and business and cultural actors in order to contribute to the labor market. The headquarters, also known as Milan International Campus, or Campus of Novedrate, is located in the ex IBM training center of Novedrate (Como, Italy), on a campus in the quiet green Brianza.
The University has 5 Virtual faculties: Engineering, Economics, Psychology, Arts, Law. THE HISTORICAL MAPS AND THE QGIS PROJECT The City Wall characterizes the city of Cesena. Its scorpion shape divides the historic center from the newly zone.
The historical cartographic documents describe its evolution and its destructions. The QGIS program allow me to compare different historical maps, because it permit to transfer all the maps in the same Reference System, with the georeferencing plugin. As a reference the open layer Google Satellite and the open layer Open Street Map have been used to refer all the historical maps to the Reference System EPSG: 3857 (Web Mercator or Pseudo Mercator).
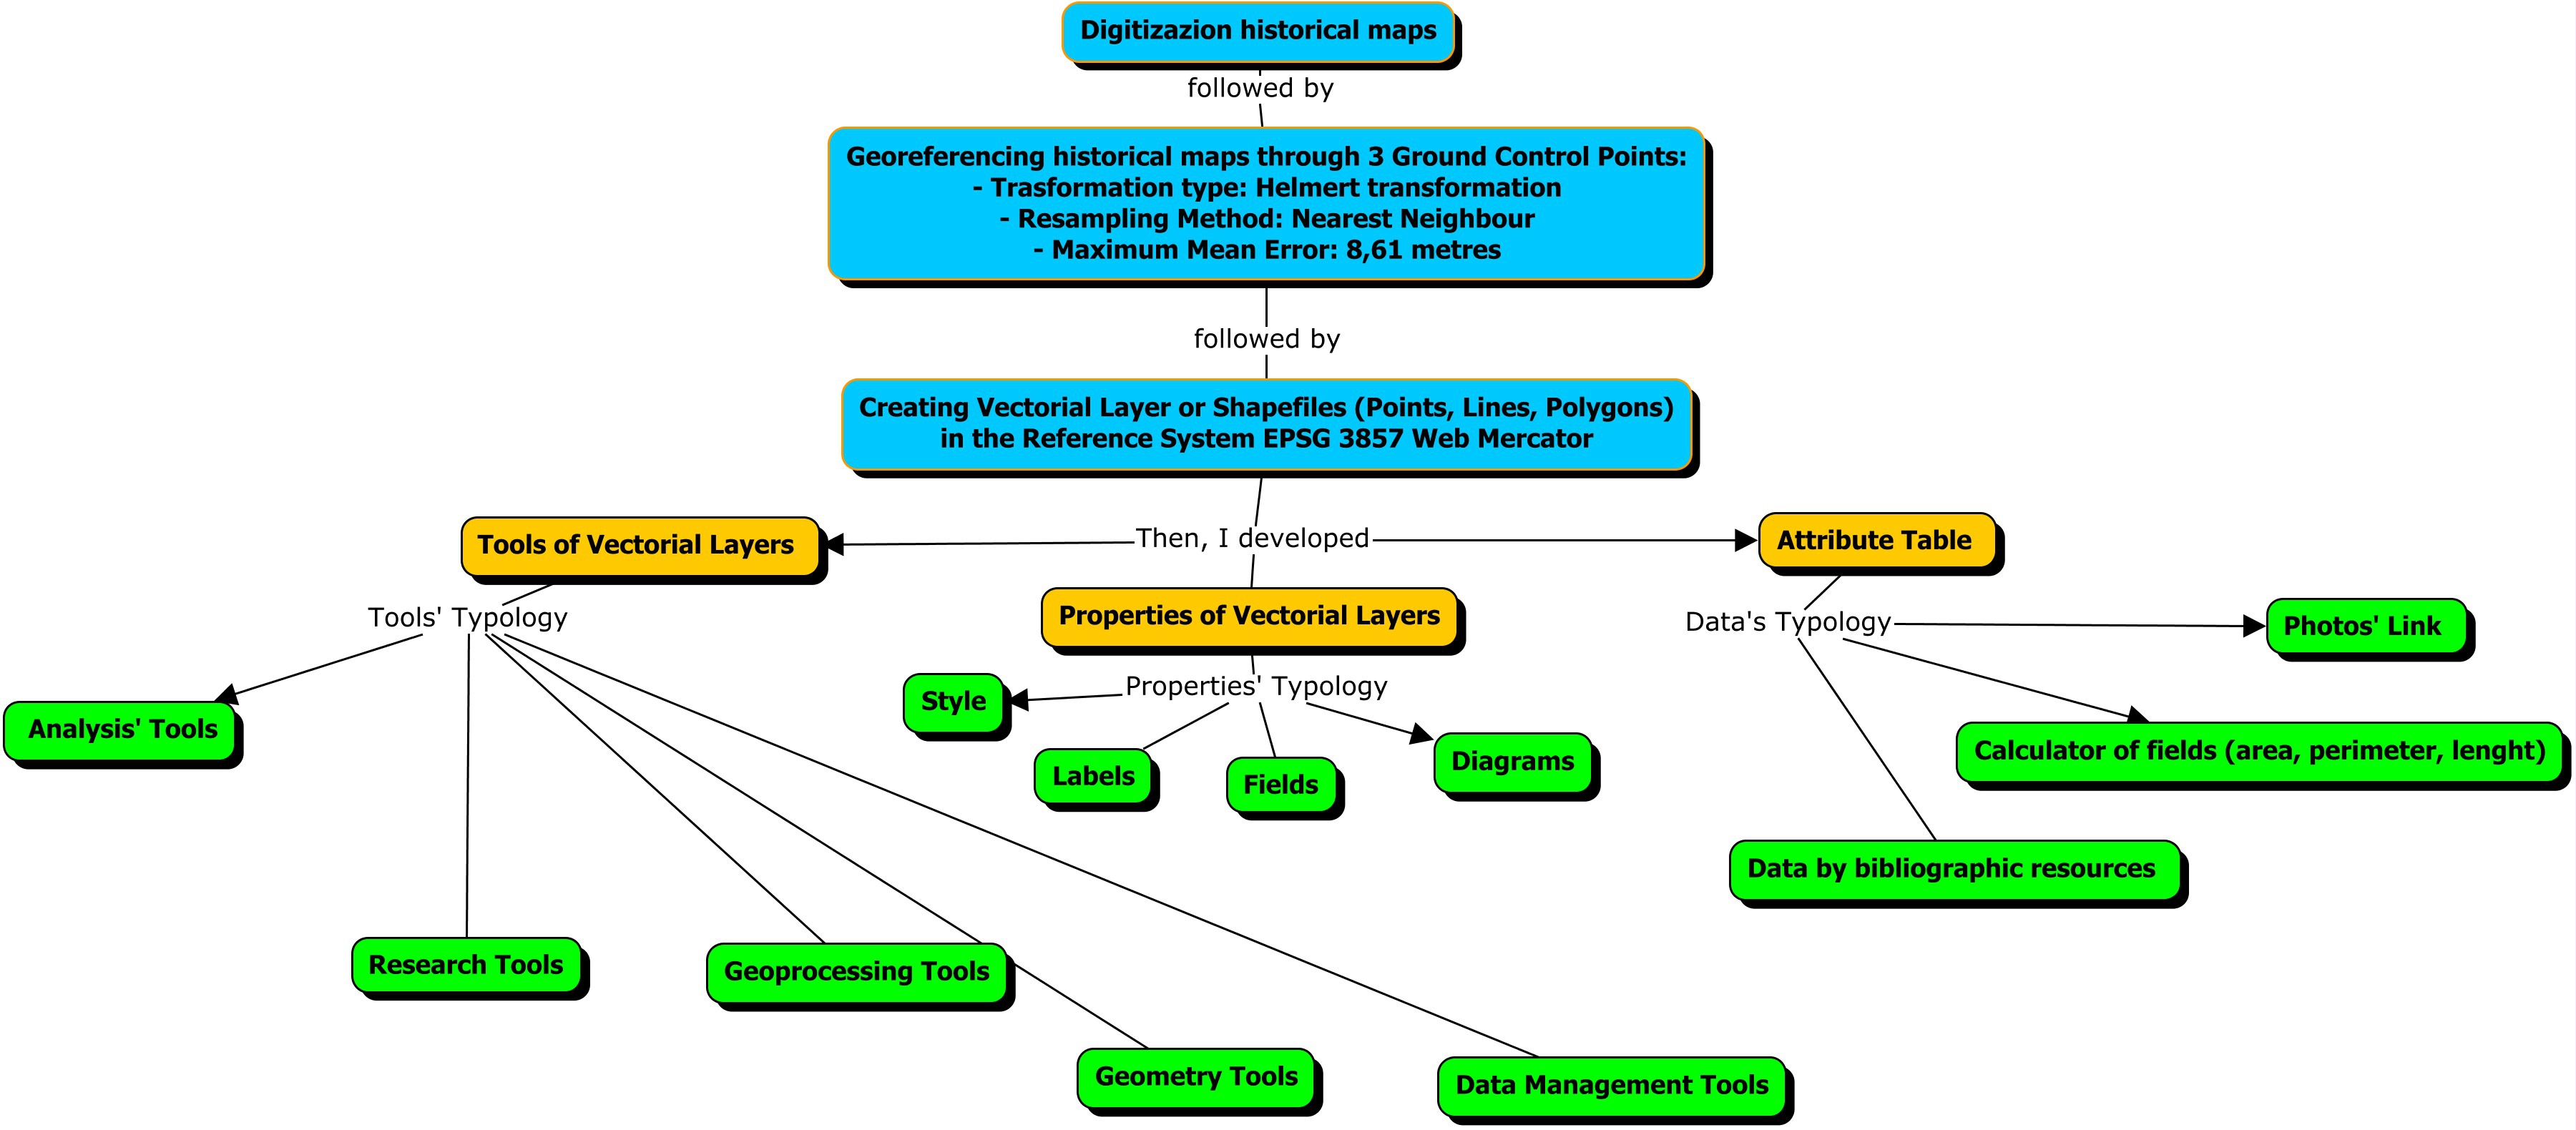
QGIS has been a fundamental tool to elaborate, analyze, compare these georeferenced maps through the vectorial layers or shapefiles, in which I memorized all the elements ofthe maps, such as roads, buildings, parks and gardens, City Wall, the ancient fortified towers and the ancient City Gates. I used puntual, linear and polygonal layers. I compared these layers through the analysis, research, geoprocessing, geometry and data management tools (Fig. 1).

Fig. 1 Concept Map of the QGIS project
Using this tools, I got informations about:
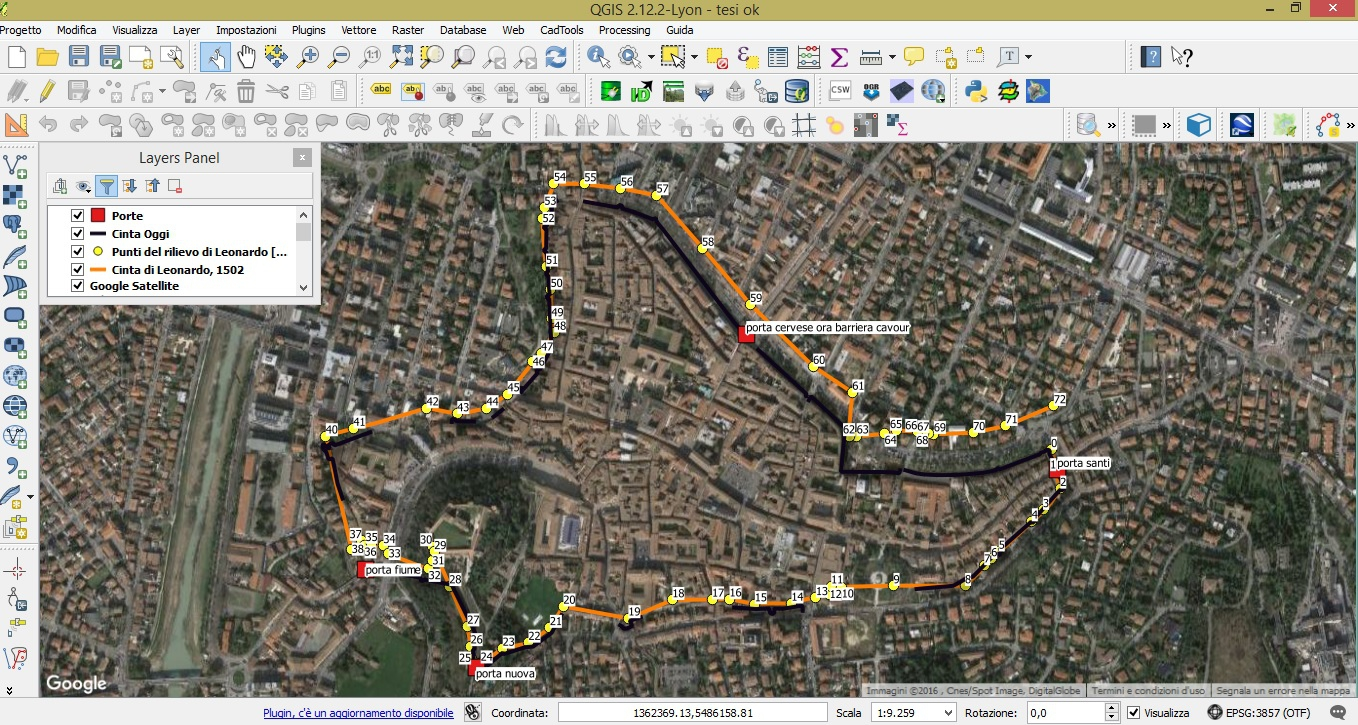
The precision of the Leonardo Da Vinci’s topographic survey, realized in 1502, such as how many points of this survey are correct (Fig. 2);
The Cesena Wall’s Development from the Roman Age to the 15th Century;
The Cesena Wall’s Demolitions from the 19th Century to the Early 20th Century;
The morphological changes of the City Wall, such as the demolitions of its ancient fortified towers and its ancient City Gates;
The Cesena’s Urban Progress from the 16th Century to the Present;

Fig. 2: Openlayer Google Satellite overlapped by the informations recorded in different layers: the present City Wall in black, the Leonardo Da Vinci’s topographic survey of the City Wall in orange, the Leonardo Da Vinci’s points of survey in yellow and the present ancient City Gates in red.
There are lots of QGIS tools, and I used some of these to create:
Links that connected each section of the linear layer of the present City Wall to photos, which represent the actual state of conservation;
A map of Cesena in the 19th Century through the print composer;
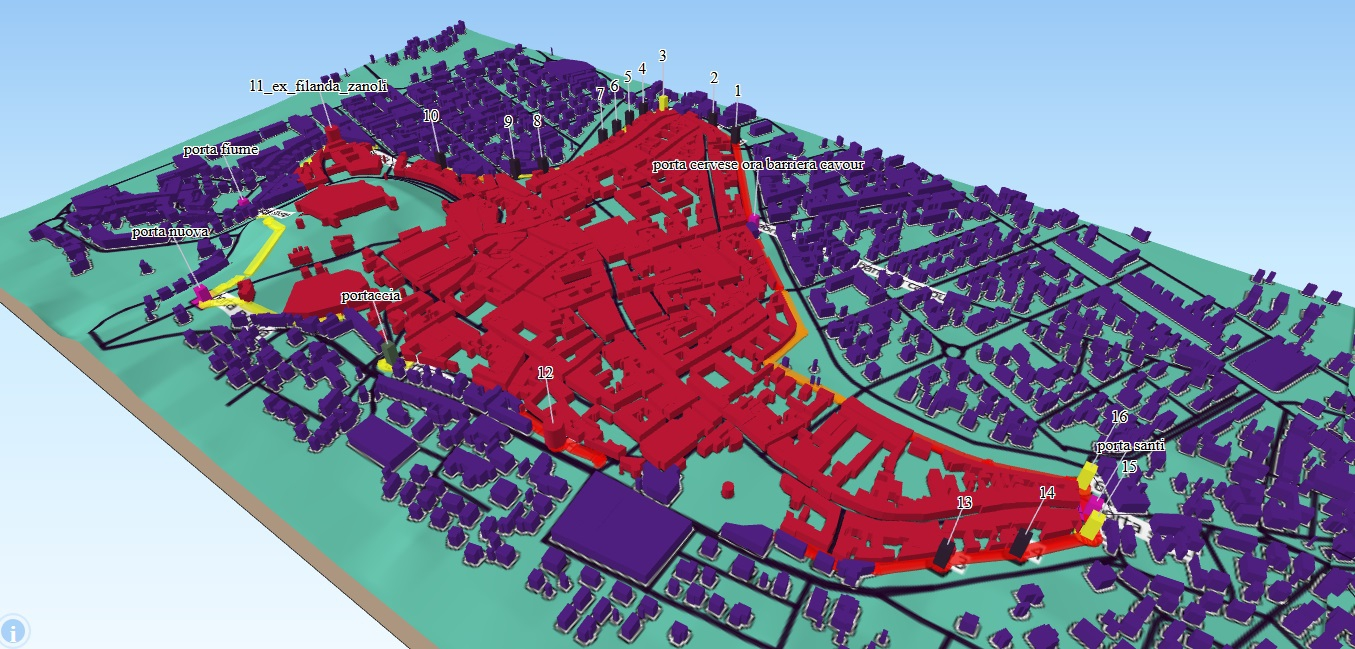
A 3D Model of Cesena with qgis2threejs plugin (Fig. 3);

Fig. 3: The 3D model of the present City Wall and Cesena’s buildings inside and outside the Wall. The ancient fortified towers and the ancient City Gates are indicated.
Conclusion
The historical maps are important documents even if its precision cannot be compared to the precision of the actual cartographic document, and they are very communicative representations also for those who are not specialists on geographic representations. QGIS was the only means that allowed me to use the numerical content of the historical maps according to an effective and meaningful representation.
Bibliographic Index
The historical maps have been extracted by:
“Costruzione, alterazione e recupero del centro storico di Cesena”, Ballardini, Cantori, Pezzi, Righetti, Tossani, Bruno Ghigi Editore, 1977
“La cinta muraria di Cesena”, Pino Montalti, Edizioni Panini, 1986
The historical informations have been extracted by:
“La cartografia in Italia: nuovi metodi e nuovi strumenti dal Settecento ad Oggi”, Andrea Cantile, IGM Firenze, 2007
“Lineamenti di storia della cartografia italiana, volume secondo, dal Seicento al Novecento” Andrea Cantile, Geoweb, 2013
“I rilievi cartografici di Leonardo per Cesena ed Urbino contenuti nel manoscritto ‘L’ dell’Istituto di Francia”, Nando De Toni, G. Barbéra Editore, 1965
“La città da guerra”, Amelio Fara, Einaudi, 1993
“La cartografia dall’antichità fino al XVIII secolo”, Carlo Monti, Maggioli Editore, 2011